We are destined to fall into a performance tar pit. It’s bound to happen. The real question is how to get out.
It starts with finding where performance goes south. That alone can be a mind-numbing slog that eats hours of expensive time better spent on improving the application. Good tools are a godsend.
Which brings me to EFProf, the Entity Framework profiling tool from Oren Eini’s Hibernating Rhinos. Most DevForce applications rely on the Entity Framework for database access and database access is often the suspected cause of performance problems.
Well, is it or isn’t it? EF Prof can help settle the question. Oren (better known by his nome-de-blog of Ayende Rahien) is the principal behind EFProf; that’s reason enough to give his tool a look.
There are free alternatives. You can fire up the SQL Server Profiler … and I do. The DevForce DebugLog is a crucial resource that every experienced DevForce developer consults as assiduously as the weather report. But I had the feeling that EFProf might provide better insights more quickly. I’m pleased to report that it does.
Setup
Ridiculously easy.
- Download and extract the zip (duh)
- Add to the web application project a reference to the EFProf profiler library, HibernatingRhinos.Profiler.Appender.v4.0
- Initialize the profiler in the Application_Start method of the Global.asax
#if DEBUG
   // Engage EF Profiler: http://efprof.com
   HibernatingRhinos.Profiler.Appender.EntityFramework.EntityFrameworkProfiler.Initialize();
#endif
The application is now instrumented in a debug build. Time to listen for those profile results …
- Run the profiler UI executable, EFProf.exe
- Enter your license key (first time only; there’s a 30 day trial)
- Launch the Silverlight application.
Now even easier: add it to your solution with Nuget and get updates automatically.
What you get
This is a “First Look”, not a tutorial, so all I’m going to do is tease you with a few screenshots.
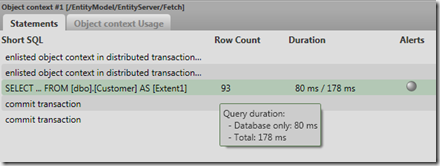
Here is the main screen after running a DevForce Silverlight automated test sequence.
Each statement was the result of a DevForce client request sent to the server and forwarded to EntityFramework; the “Object context #1” is the Entity Framework ObjectContext instance created in the DevForce EntityServer query pipeline. The highlighted request is the first query:
That’s a query for all customers. The total time of 178 milliseconds is dominated by something outside the database. Here is that same customer query, issued a second time.
Didn’t take nearly as long, did it. That’s because there is a hefty start-up time for both Entity Framework and the database.
Notice the ball in the “Alerts” column. EFProf evaluates each Entity Framework operation and reports an alert if it thinks there is potential trouble in that operation. The alerts tab explains:
If I don’t know what “unbounded result set” means, I click “read more” and see a web page that tells me the query could return far more data than would be good for me. It’s right in this case because the query lacks a “Where” clause; it fetches all customers … as can be seen in the Details tab:
Here’s what an individual update operation looks like:
EF uses parameterized values in updates. That’s an essential guard against SQL injection attacks but it makes it a little rough on humans reading the SQL. EF Prof offers a friendlier view.
Analysis
So far this is a more pleasant experience than working with the SQL Profiler. We’re getting a bridge between SQL and Entity Framework, the presentation is more helpful, and we’re getting some advice by way of alerts.
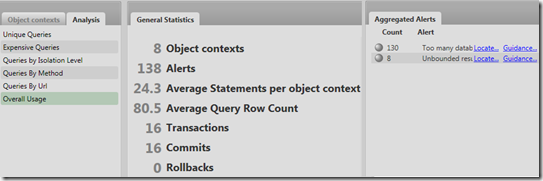
It gets better. Check out the Analysis choices. Three strike me as most useful for a DevForce Silverlight application:
Queries by Uri isn’t that helpful in DevForce Silverlight because the requests come as WCF Posts to two service addresses. That analytic tab would be more useful in a DevForce web application or when analyzing the DevForce OData activity with a phone application.
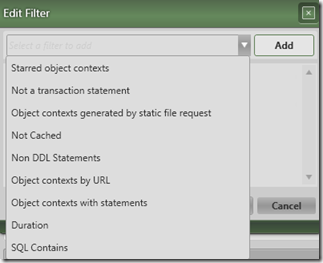
You can apply filters to scope the analysis:
And apply them in combination:
In this case, I marked selected “Object context” cases with colored stars (I get to pick the color) and restricted to operations within those contexts that took more than 25 milliseconds.
I think the combination of filters and summarizations will be a powerful lens on the data both for finding trouble and conveying my “actionable” message to the developer who needs to fix it.
Cost and ROI
An EFProf license costs ~$300.
Hey, I love free – who doesn’t - but I am more than happy to pay up for a tool that spares me pain. I flatter myself by thinking I’m worth at least $50 per hour. I figure EFProf is sure to save me six hours of fumbling through database profile logs, documenting the madness, and confirming that someone fixed it. It’s all gravy if it saves me more.
Take a look – it’s got a 30 day trial. You’ll be glad you did.


